- The Discount Newsletter
- Posts
- The Stock Market is Cracking...
Welcome to The Discount 💰 Dive deep into financial markets with us every week.
The stock market is starting to crack…
Last week, the S&P 500 fell 2.9%, while the Nasdaq 100 slid 3.5%.
The major indices are now 6% and 7%,, respectively, since topping out in late July.
This alone isn’t reason to panic. After all, pullbacks are perfectly normal… especially since the stock market got off to such a hot start in 2023.

But the indices also don’t tell the whole story. And the stock market looks even weaker upon close inspection.
The chart below says it all. Here, we’re looking at how the eleven different sectors in the S&P 500 performed last week.
They all ended the week deep in the red. Even defensive sectors got slammed as consumer staples, healthcare, and utilities stocks closed the week down 1.7%, 2%, and 2.1%, respectively.

In other words, there’s been nowhere for investors to hide!
Today, we’re going to explain what this means for the stock market.
But before we do that, we want to welcome you to The Discount Weekly. Each week, we examine the biggest issues facing traders and investors… and explain how they impact your portfolios.
This week’s issue is all about stocks… and why it’s currently under so much pressure.
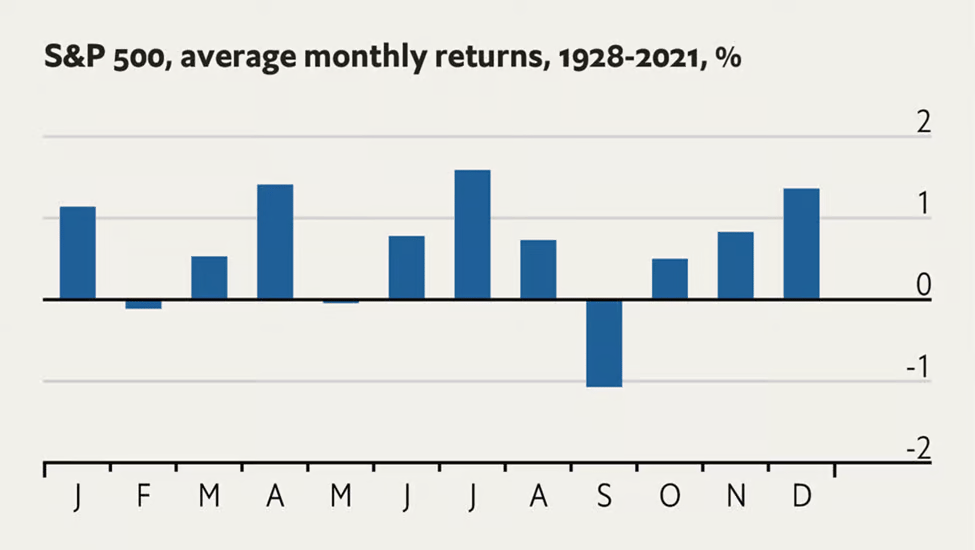
One of the biggest headwinds facing the market currently is “seasonality.” This is the idea that the stocks follow predictable patterns around the calendar year.
If you’ve been keeping up with us at The Discount, you know why this is important…
Last month, we explained how the stock market was about to enter the worst month of the year for stocks.
Since 1928, September has been the weakest month of the year for stocks. On average, stocks have fallen about 1% during the month of September. No other month even comes close.
This is why we told Discount readers last month to brace for a bumpy road ahead. And that’s exactly what happened.
Unfortunately, seasonality isn’t the only major headwind facing the stock market today.
Interest rates are also surging.
See for yourself. This chart shows the yield on the U.S. 10-Year Treasury. We can see that it just broke out to the upside after trading sideways for the past year.
“Breakouts” like this often signify the beginning of a new uptrend.
In this case, we wouldn’t be surprised if visits 5% or even slightly higher in the months ahead.

A major breakout like that would have MAJOR ramifications for both the stock market and the economy.
Remember, interest rates are the cost of money. When they rise, everything from buying a house to a new car gets more expensive. It also becomes more expensive for businesses to borrow money.
To complicate matters, the recent spike in interest rates lately could be the start of a much, much bigger move.
Take a look at this chart. It shows the performance of the 10-Year Treasury yield, only this time the data goes all the way back to the 1980s.

We can see that interest rates steadily fell for nearly four decades. This is because bonds were in a “secular bull market”
And because bond prices and interest rates are inversely correlated, rates fell during this period. It’s how zero interest-rate policies and negative interest-rate policies came to be.
Unfortunately, the days of easy money appear to be over. As you can see below, the U.S. 10-Year Treasury Yield recently broke its four-decade downtrend… potentially signaling the beginning of a long-term bond bear market.
Now, we know this is a lot to digest. But the main insight you should take from this is that we could be entering a period where interest rates rise significantly over the long-term.
It’s important to maintain a long-term perspective.
But we’re also interested in taking advantage of short and medium-term trading opportunities. So, it’s important to trade the charts in front of you.
In this case, we can see that the S&P 500 has already pulled back sharply. It’s now testing its late 2022 summer highs.
This is an area where buyers could potentially step in and produce a short-term bounce opportunity.
“But When and Where Exactly?”
Join us in our FREE Telegram Channel. We update our followers in real-time, with common sense analysis on the trades we are taking, currently in, and keeping our eye on. Common sense analysis that anyone, from beginner-to-advanced, can easily understand and take advantage of.
Don’t forget to follow us on YouTube for market updates as well.
P.S. - If you are interested in LIVE Trading, Monday - Friday mornings, we have a LIVE Day Trading Room with over 50+ professionals, intermediates and beginners. Give it a test drive 7 Days for $7 here.

See You Next Sunday!