- The Discount Newsletter
- Posts
- The Melt-Up Before the Recession
The Melt-Up Before the Recession
Three Reasons Stocks Could Rally From Here...
The Discount Newsletter
November 05, 2023

Welcome to The Discount 💰 Dive deep into financial markets with us every week.
Markets can change direction on a dime.
Just two weeks ago, stocks looked awful.
The indices were getting slammed. Small caps were rolling over. And many individual stocks looked poised for major breakdowns.
We also have seen broad bearish sentiment out there, and rightfully so.
The global economy is showing dire signs of slowing down, which can and will have a significant and widespread impact on markets, retirements and individuals’ livelihoods.
But that aside… we are not here to be right.
We are here to make money.

The recent drawback in stocks has been downright ugly. In fact, there was little to be bullish about.
We even caught the short (and we are now long) near the top of the SP500 in our FREE Telegram Channel.
But, as always, the market fooled the majority…
That’s right. The market just pulled a complete 180.
Last week, The S&P 500 climbed nearly 6%, while the Nasdaq surged 6.5% higher.
Many big, important stocks performed even better.
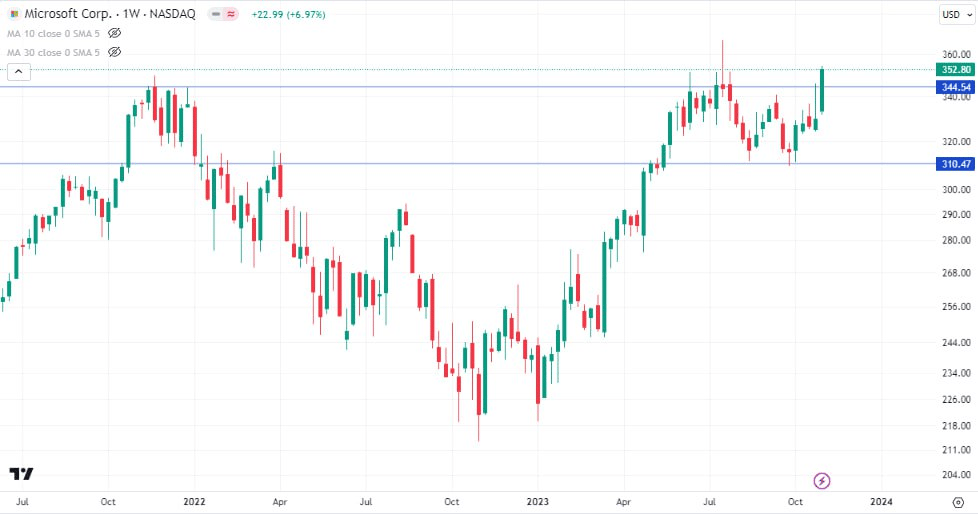
Microsoft (MSFT), for one, spiked nearly 7% last week. More importantly, it had its highest weekly close ever.
Nvidia (NVDA) also has a strong showing.
It rallied 11% higher on the week… just as most traders were getting bearish on the name.
This is a huge deal.
Microsoft and Nvidia aren’t just two of the world’s largest stocks. They’re also poster childs of artificial intelligence (AI), which has been the dominant bullish narrative this year
In short, it’s hard to be bearish on the broad market if they’re performing well and into major support from a technical standpoint.
And it wasn’t just the mega cap tech leaders that bounced back…
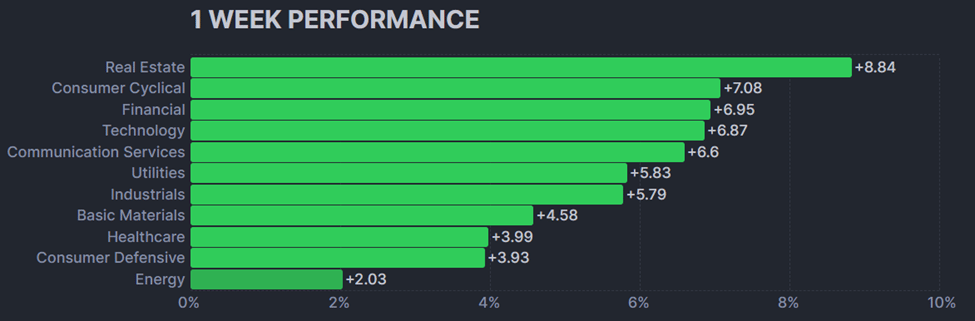
Many stocks participated in last week’s rally. In fact, all eleven major sectors in the S&P 500 closed the week higher.
Real estate, which has been a major underperforming lately, led the way. It gained nearly 9% on the week! It was one of seven sectors that climbed more than 5%.
You can’t ignore this type of price action. It could represent a major change in character for the stock market. We’ll explain why in a minute.
But we want to first welcome you to The Discount Weekly. Each week, we look at the biggest issues facing traders and investors… and explain how they impact your portfolios.
Today, we’re going to examine the impressive snap-back rally in stocks… and explain why it could have legs.
Let’s dive right into things…
Stocks LOVE This Time of the Year
If you’ve been reading The Discount, you know we place a ton of importance on “seasonality.”
This is the notion that stocks follow predictable patterns around the calendar year.
Historically, September has been the worst month of the year for stocks. On average, the S&P 500 has fallen more than 1% during the month.
This year, stocks fared even worse. The S&P 500 fell 5.1% in September. Then, it fell 2.2% lower in October.
The good news is that we just entered the best time of the year for stocks. Historically, the S&P 500 has performed best from October through January.
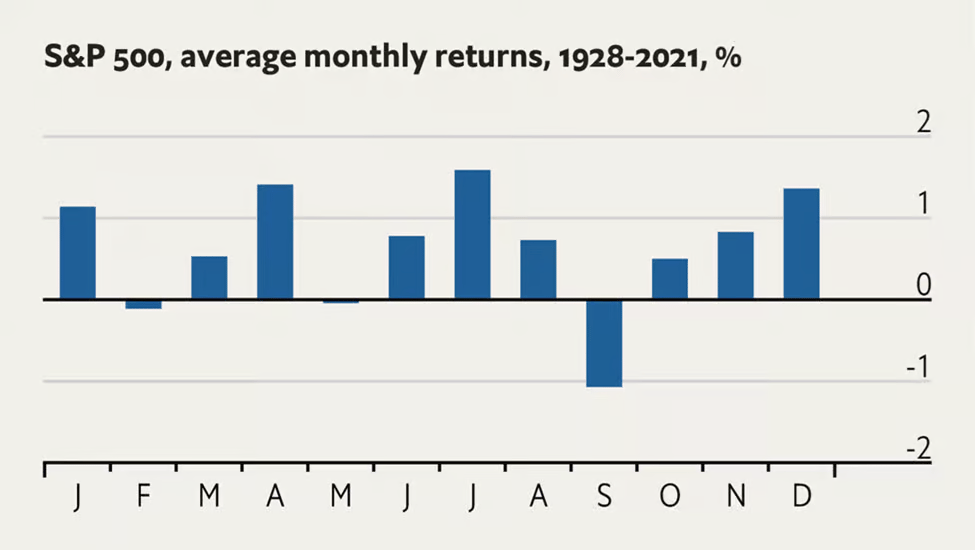
In other words, it would be perfectly normal for stocks to finish the year now that the worst seasonal period of the year is behind us.
But that’s not the only factor working in the market’s favor…
The Dollar Is Rolling Over
The dollar just reversed course in a big way.
Take a look at this chart. It shows the performance of the U.S. Dollar Index. This index measures the dollar’s performance against a basket of currencies, including the euro and the Japanese yen.
Last week, the Dollar Index fell 1.4%. That might not sound like much.
But this is a major move for the dollar. In fact, last week was the dollar index’ worst weekly performance since July.
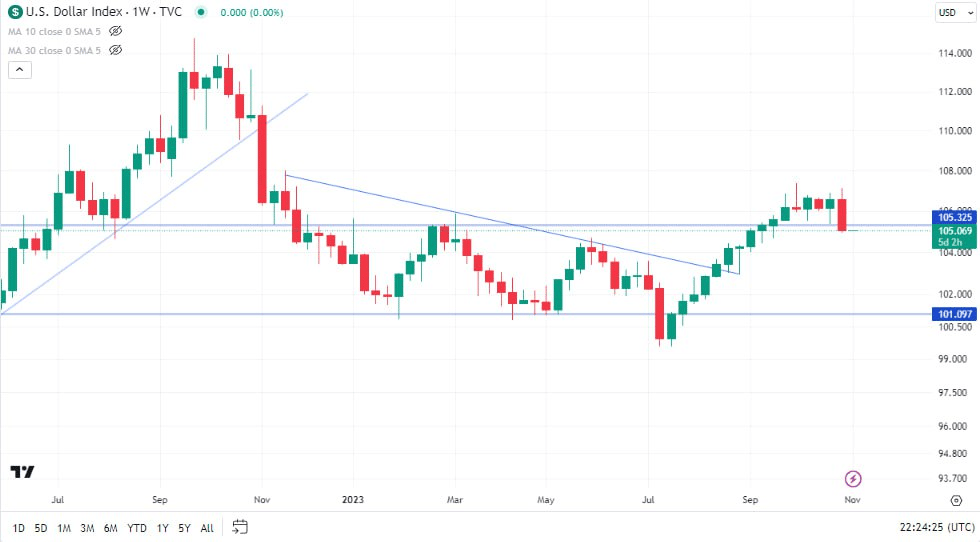
That’s an encouraging development.
As we’ve explained before, stocks don’t like it when the dollar is rising. It’s much more bullish when the dollar is trading sideways or falling… like it is now.
Buyers Are Coming Back Into the Bond Market
The bond market is also showing signs of life.
Take a look at this chart. It shows the performance of the iShares 20+ Year Treasury Bond ETF (TLT) since it was launched in 2002.
We can see that TLT has recently erased all of the gains since its inception. This coincided with the worst bond market selloff in history.
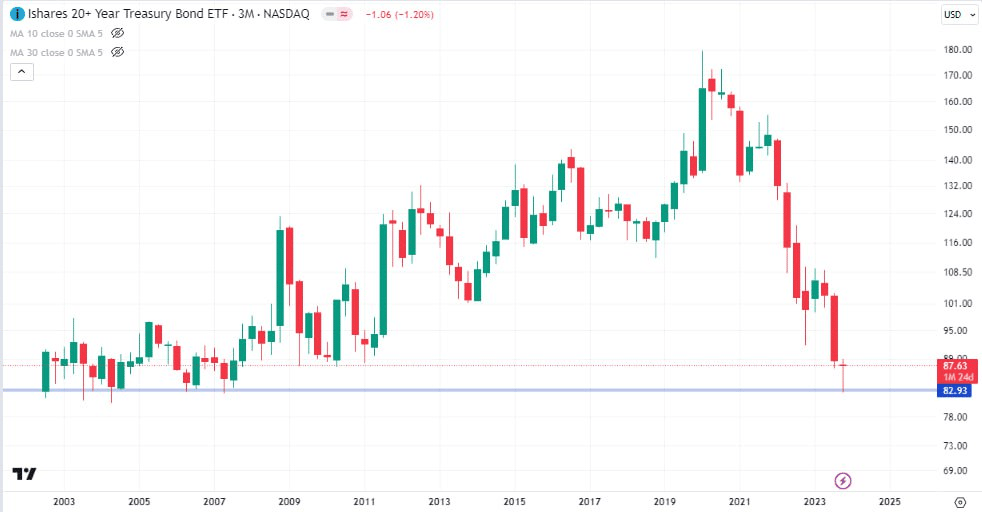
TLT is now trading back at the same price it did more than 20 years ago.
This is also a major psychological level. You would expect buyers to step in here. And that’s starting to happen. Last week, TLT rallied alongside stocks… jumping 3.9%.
Here’s why this is important…
Bond prices trade inversely with interest rates. In other words, interest rates decline when bonds rally.
So, rates could be headed even lower if buyers continue to enter the bond market.
If that occurs, the stage could be set for a major stock market rally.
Join us in our FREE Telegram Channel. We update our followers in real-time, with common sense analysis on the trades we are taking, currently in, and keeping our eye on. Common sense analysis that anyone, from beginner-to-advanced, can easily understand and take advantage of.
Don’t forget to follow us on YouTube for market updates as well.
P.S. - If you are interested in LIVE Trading, Monday - Friday mornings, we have a LIVE Day Trading Room with over 50+ professionals, intermediates and beginners. Give it a test drive 7 Days for $7 here.
See You Next Sunday!