- The Discount Newsletter
- Posts
- Crash Mode Activated?
Welcome to The Discount 💰 Dive deep into financial markets with us every week.
The stock market is starting to unravel…
Last week, the S&P 500 closed the week down 2.4%. The tech-heavy Nasdaq dropped 2.9%.
And it’s even worse below the surface.
On Friday all eleven sectors closed the day red. And just two sectors closed the week higher, as consumer defensive and energy stocks eked out small gains.
Now, it shouldn’t be a complete surprise that stocks are struggling.

As we’ve explained in past issues, stocks are dealing with some serious headwinds currently.
For starters, interest rates keep marching higher. Last week, the yield on the U.S. 10-Year Treasury hit the highest level since 2007!
The U.S. Dollar Index also remains incredibly strong. And the conflict in the Middle East appears to be intensifying.
Of course, fear often precedes opportunity.
So… is a major buying opportunity setting up in stocks? Or will the market continue to struggle?
That’s what we’re going to examine here today.
But we want to first welcome you to The Discount Weekly. Each week, we dive head first into the biggest issues facing traders and investors… and explain how they impact your portfolios.
Today, our focus is once again stocks, specifically our concerns about the market.
Let’s jump right into it…
Even the Generals Are Getting Shot
If you’ve been following the market lately, you’ve probably heard about “The Magnificent Seven.”
This relatively new term refers to Apple (AAPL), Microsoft (MSFT), Alphabet (GOOG), Amazon (AMZN), Nvidia (NVDA), Tesla (TSLA), and Meta Platforms (META).
These stocks have carried the market this year. In fact, they account for 98% of the market’s gains in 2023.
Needless to say, this is NOT a sign of a healthy market.
During a healthy bull market, many stocks are doing well. There’s more participation.
The good news is these stocks have done phenomenally this year. Nvidia, for one, is still up 183% on the year, while Meta is up 156% on the year.
The incredible strength of these huge stocks has masked a lot of the market’s issues.
Our concern is that these tech leaders, or what many call the “generals,” could get taken out next.
Take a look at this chart below…
It shows the performance of the NYSE Fang Plus Index. This index tracks the performance of ten large and mega-cap tech stocks, including Apple, Microsoft, Amazon.
We use this index to quickly gauge how the world’s most important stocks are performing.
Below, we can see that this important index may have recently put in a “double top” patterns. This means that the index failed to reclaim its late 2021 highs.
That alone is concerning.
But the NYSE Fang Plus Index is also starting to lose momentum. Since the summer, it’s put in a series of lower highs. And it’s been unable to reclaim its 10-week (50-day) moving average.
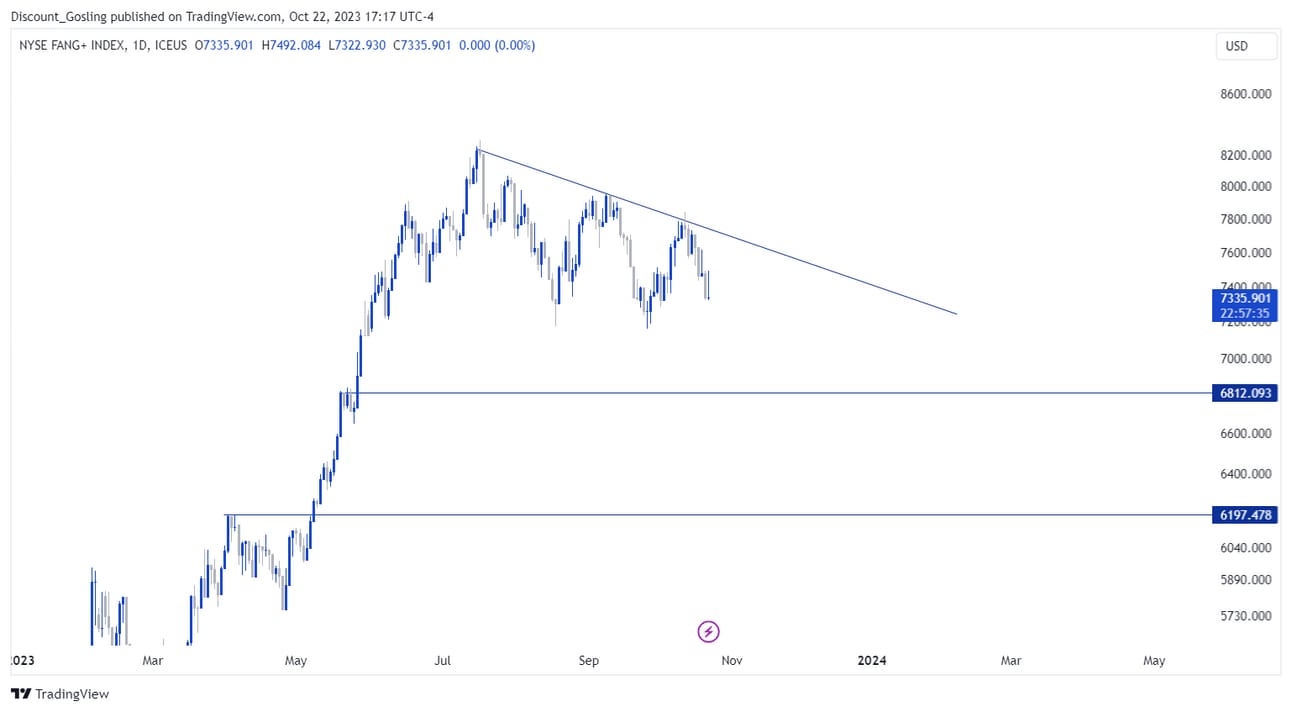
In short, mega cap tech stocks are starting to look toppy.
If they break down from here, that will put tremendous pressure on the indices. And there’s a good chance that happens.
To understand why we say this, let’s look at a few individual charts. First up is Nvidia.
After leading the market for most of 2023, Nvidia has stalled out in a big way.
It now appears to be putting in a “head and shoulders” topping pattern. If NVDA breaks down from here, it could easily “fill the gap” that dates back to May.
That’s 23% lower than current prices! So, we’re talking about a ton of potential downside.
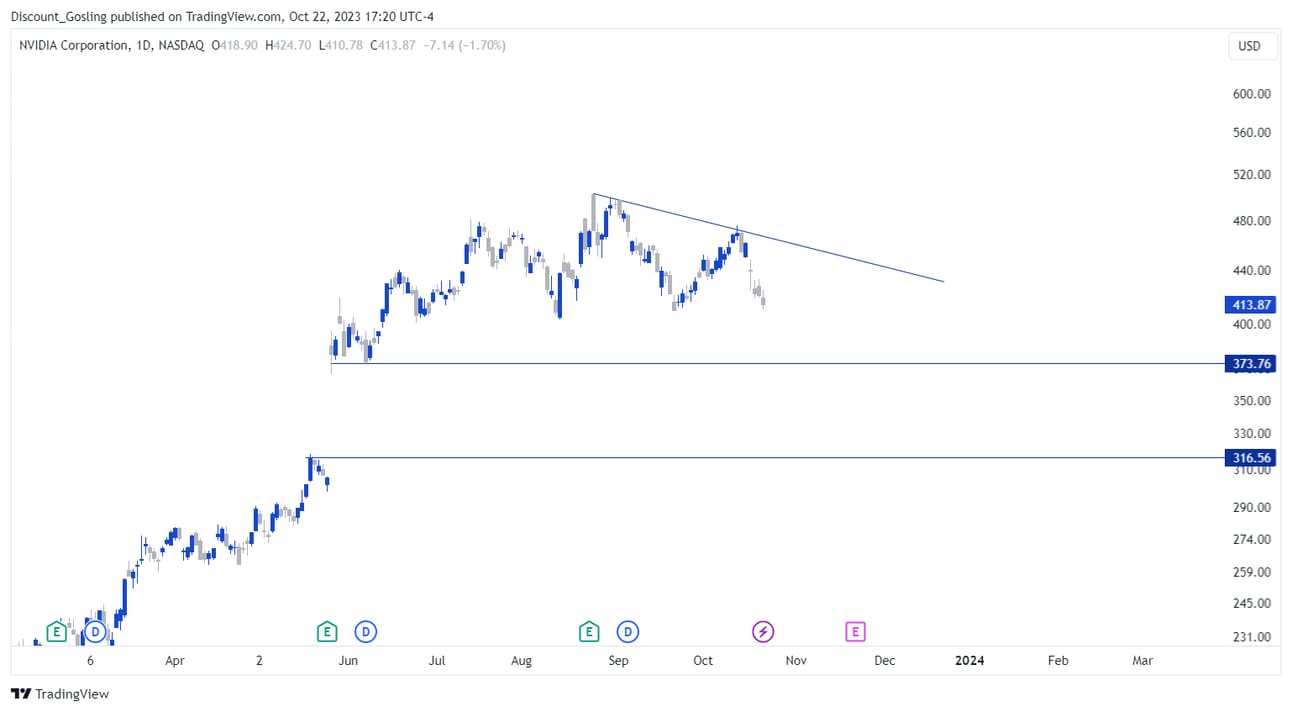
This is a big deal even if you don’t own shares of Nvidia.
Remember, Nvidia was the stock to own for much of 2023. Because of this, its performance can tell us a ton about investor sentiment.
Tesla - another popular barometer of risk appetite- is faring even worse. You can see what we mean below.
Last week, Tesla broke down in a big way… falling 16% after sharing poor quarterly results.
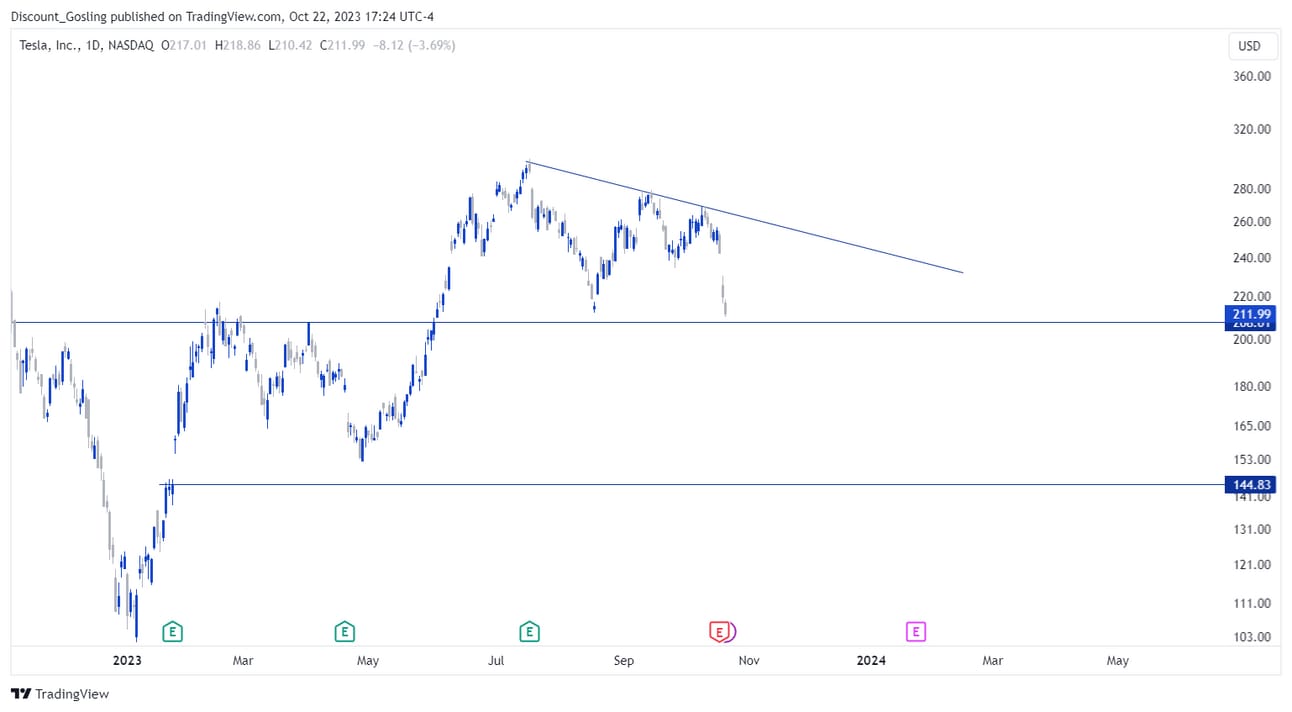
If these stocks don’t turn around soon, the entire stock market could be in major trouble.
Market Breadth Continues to Deteriorate
It’s not the big stocks that are flashing danger.
Small cap stocks are also struggling in a big way.
You can clearly see this below. This chart shows the performance of the Russell 2000 ETF (IWM).
IWM has massively underperformed both the S&P 500 and Nasdaq this year. It’s now pressing against a key support that dates back to 2020… just before the Covid market crash.

If this level breaks, small caps could be in serious trouble. Unfortunately for the bulls, there’s a good chance that IWM rolls over from here.
To understand why, take a look at this chart of the iShares Microcap ETF (IWC), which invests in “microcap” stocks.
Here, we can see that IWC has already taken out its pre-COVID highs.
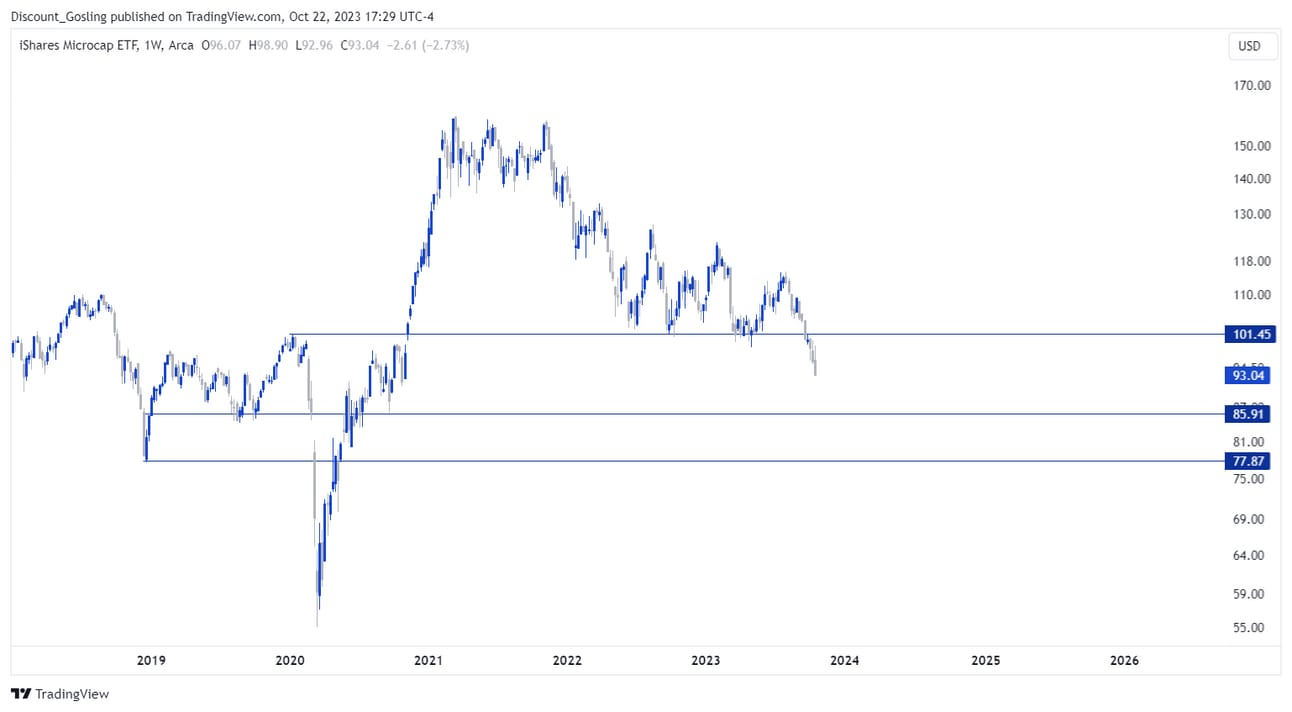
That makes sense. Microcaps are the smallest stocks in the entire market. They’re even riskier than small caps. So, it would be perfectly normal for them to “lead” the market lower.
In closing, stocks are looking more vulnerable by the day. So, exercise caution if you’re looking for long opportunities.
You might even want to consider dollar cost averaging into some hard assets like gold or bitcoin… which are both holding up much better in the current environment.
Join us in our FREE Telegram Channel. We update our followers in real-time, with common sense analysis on the trades we are taking, currently in, and keeping our eye on. Common sense analysis that anyone, from beginner-to-advanced, can easily understand and take advantage of.
Don’t forget to follow us on YouTube for market updates as well.
P.S. - If you are interested in LIVE Trading, Monday - Friday mornings, we have a LIVE Day Trading Room with over 50+ professionals, intermediates and beginners. Give it a test drive 7 Days for $7 here.
See You Next Sunday!