- The Discount Newsletter
- Posts
- We're Buying the Dip
Welcome to The Discount 💰 Dive deep into financial markets with us every week.
The first week of 2024 is in the books!
And from the looks of it, we have a classic, “Post-Santa Rally” correction and/or relief pause, across the board for most stocks, indices and crypto.
This time it appears everyone wanted to harvest those tax losses for 2024, instead of 2023. I wonder why…
But we’re not buying that this is the grand finale, double top in markets and everything is going south from here for a long, long time... not yet at least.
No… we’re buying the dip.
“But when?” you ask…

If you’ve been here long enough you know we have a 100% FREE Telegram Channel. We post our investment / trade ideas in real-time. No strings, no catch. That’s it. You can follow along in there if you’re not already, for WHEN we are pulling the trigger on certain plays for this Q1 2024 correction.
In our weekly Sunday Special newsletters, as well as our telegram, we called out and were positioned for this past Santa Rally / melt-up in 2023 after the October correction.
Now, we’re on the watch for how shallow or deep this correction will be across stocks, indices and crypto.
For the purposes of this issue, we’re just going to focus on the indices, particularly the SP500. Of course we are watching the major stocks driving these indices, and playing those on the long side if/when the time comes… but we like to keep it simple for now.
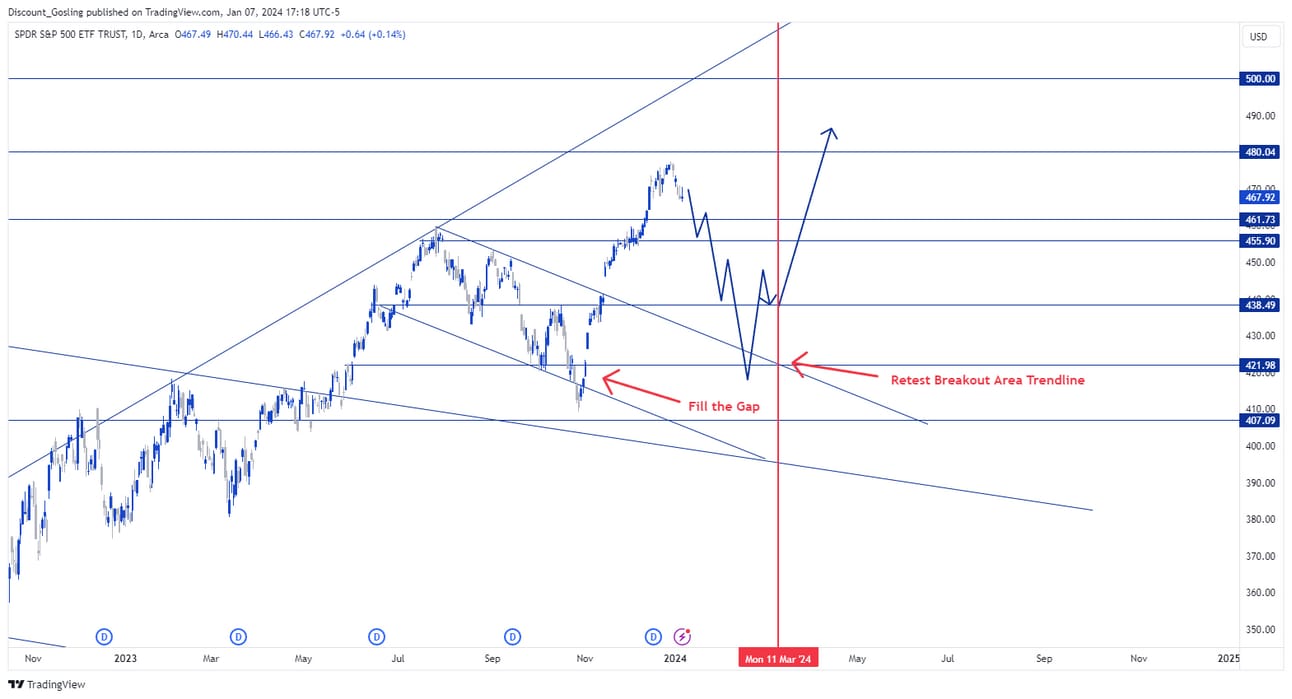
S&P500
As you’ll notice, there were a TON of “gaps” created on the daily chart below, to the south side. And gaps on the indices typically like to get filled sooner than later.
Now here’s the trick… we’re not confident that those gaps get filled on this run. Why? There are so many people still shorting the pants off this market, climbing the wall of worry and in disbelief as we melt-up into the face of a technical recession.
The individual stocks underlying the S&P500, Nasdaq and even small caps in the Russell 2000, are showing serious strength and bullish posturing.
So, here are the THREE S&P500 / SPY scenarios we see potentially playing out in Q1:
Weekly Chart for reference (no drawings)

1.) SPY Scenario #1
The “Shallow Fake-Out” Correction
Approx. 5% drawdown
Bottom end of January to mid-February

2.) SPY Scenario #2
The “Normal” Correction
Approx. 8% drawdown
Bottom in March

3.) SPY Scenario #3
The “It’s Over” Correction
Approx. 13% drawdown
Bottom end of March
We’ll be watching all three scenarios to pull the trigger on longs in individual stocks showing relative strength as well as call options in the indices.
One chart in particular that we are watching, is ARKK Innovation ETF.
Right now, you can see the ARKK ETF is having a healthy pullback into a major potential bottoming / accumulation zone.

There are a ton of other individual names, and we’ll be posting in the free channel when the time comes.
Here’s one more you might have heard of:
NVDA

Join us in our FREE Telegram Channel. We update our followers in real-time, with common sense analysis on the trades we are taking, currently in, and keeping our eye on. Common sense analysis that anyone, from beginner-to-advanced, can easily understand and take advantage of.
P.S. - If you are interested in LIVE Trading, Monday - Friday mornings 8am - 12pm EST, we have a LIVE Day Trading Room with over 50+ professionals, intermediates and beginners. Give it a test drive 7 Days for $7 here.
See You Next Sunday!