- The Discount Newsletter
- Posts
- What is Bitcoin Telling Us Right Now?

Welcome to The Discount 💰 Dive deep into financial markets with us every week.
Bitcoin is boring.
Over the past month, the price of bitcoin has hardly moved.
It’s been stuck just below $31,000.

Not only that, bitcoin volatility has reached extreme lows.

BTC - Implied Volatility Chart
Stocks, on the other hand, have been on an absolute tear.
On Friday, S&P 500 and Nasdaq had their highest weekly closes since January 2022. These indices are now up 19% and 44% on the year, respectively.
Investors aren’t used to this. Normally, bitcoin leads “risk assets” higher.
This kind of boring price action can have a profound impact on sentiment.
It can cause investors to lose conviction… or even sell out of sheer boredom to chase faster moving assets.
But that’s the last thing you should be doing.
Quiet markets are some of the best times to accumulate assets. That’s particularly true for bitcoin right now in our opinion.
We’ll explain why in this issue. As you’re about to see, the fundamentals of bitcoin remain as strong as ever. By the end of this issue, you understand why right now is an incredible time to be dollar-cost averaging (DCA) into bitcoin and as an active trader, be on your toes for a sell-off and bottom.
But we want to first welcome you to The Discount. Each week, we dive head first into the biggest issues facing traders and investors… and explain how they impact your portfolios.
Today’s issue is all about bitcoin… specifically what’s happening below the surface. So, let’s dive right into things.

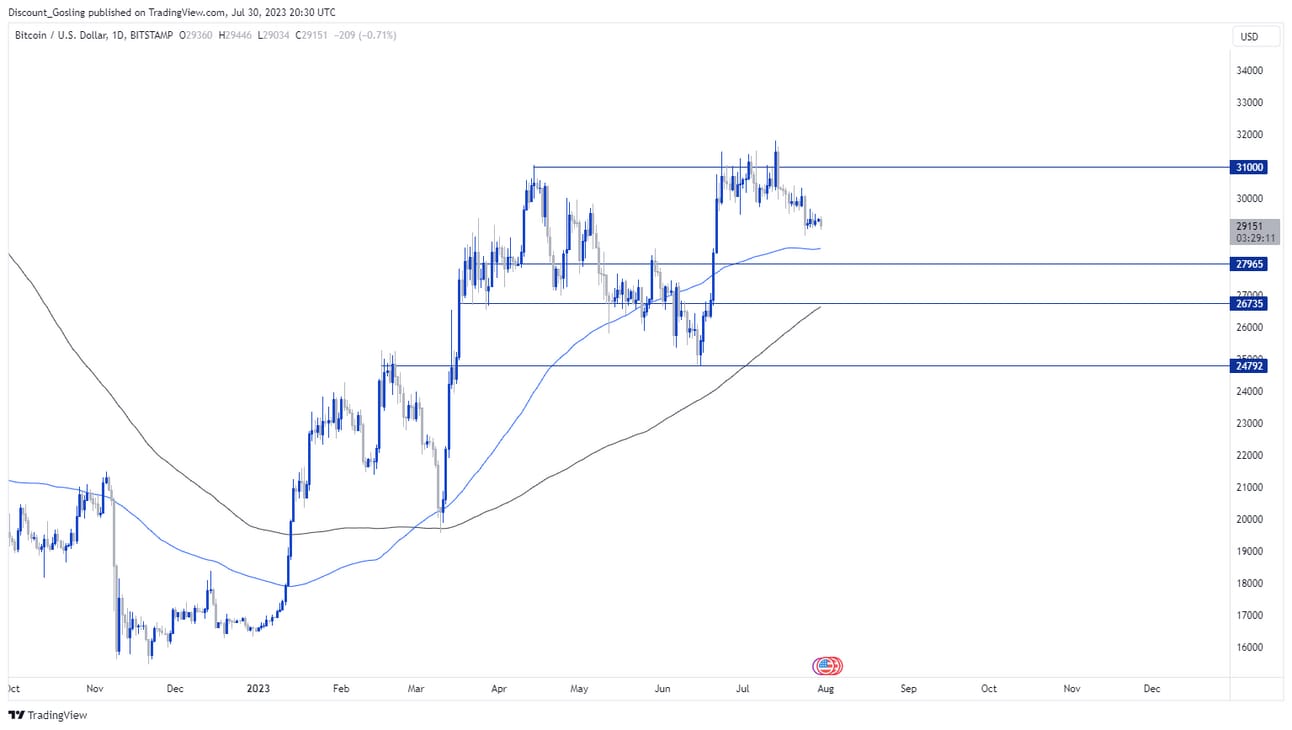
BTCUSD - Daily Chart
Strong Hands Prevail
Right now, the public doesn’t seem to care much about bitcoin.
It’s boring compared to stocks.
But interestingly, hardcore bitcoiners haven’t succumbed to fear of missing out (FOMO). Instead, they keep loading up on bitcoin.
The chart below says it all.
You’re looking at the supply of bitcoin held by long-term bitcoin holders. We can see that “hodlers” have kept buying bitcoin… despite the fact that it’s been trading sideways for weeks.

Here’s another chart that tells a similar story. This one shows the supply of bitcoin that hasn’t moved in two years or longer.
We can see that the supply of “inactive” bitcoin has surged in 2023.
This tells us that bitcoin believers are doing two things. One, they continue to buy bitcoin at current prices. Two, they’re not selling bitcoin… even to chase faster moving stocks.
This is very bullish. It tells us that there’s a growing number of people who have strong conviction in owning bitcoin for the long term.
And those “strong hands” are needed for bitcoin to become a multi-trillion dollar, global store of value.

Of course, it’s not just hardcore bitcoiners who are buying bitcoin here.
We’ve also seen a steady increase in the number of bitcoin wallets… despite the fact that bitcoin is still trading more than 50% off its all-time highs.

Now, we realize not everyone who reads The Discount is a long-term investor and many are traders first and foremost.
And traders like action. They like assets that are trending.
So, check out this chart. It shows the net realized profit/loss for bitcoin holdings. When this ratio goes negative (red), it means bitcoiners are selling at a loss. When it's positive (green), it means recent bitcoin buyers are up on their purchases.
We can see that bitcoin has historically bottomed when this ratio goes deep in the red. That’s because it marks “capitulation” events, which is when investors sell at a loss en masse.
When this ratio goes green, it often marks the beginning of a new bull market.
We mention this because this ratio just flipped green. This is huge news. It suggests that bitcoin could be the very early innings of a new bull market!

This is great news for both long-term investors and traders. It means bitcoin could soon wake up in a big way.
Of course, the on-chain metrics are just one piece of the puzzle. We still want to see bitcoin’s chart confirm this bullishness before getting too excited.
Unfortunately, that hasn’t happened yet.
Below, we can see that bitcoin is still struggling to reclaim that key $31,000 level. The good news is that bitcoin hasn’t broken down yet. And its rising 100-day moving average has caught up to its current price.
This is relevant for a couple reasons. For one, it tells us that the longer-term trend of bitcoin is still higher.
Bitcoin’s rising 100-day and 200-day moving average has acted as strong support during pullbacks.
In closing, right now looks a great time to start accumulating bitcoin as a long-term investor.
However, for more active traders, we want to see bitcoin’s price action confirm what we’re seeing on-chain before we aggressively look for new trades here.
We will be launching The Discount Portfolio soon. Here you can track all of our long term, mid-term, and short-term trades in real-time, with common-sense analysis for each position we take.
Until The Discount Portfolio launches, we update everyone in our Telegram Channel on trades we are taking, currently in, and keeping our eye on.
A service that anyone, from beginner-to-advanced, can easily understand and take advantage of.
Be sure to subscribe via email, if you haven’t already, to receive the notification when our portfolio service launches.
Don’t forget to follow on YouTube for video breakdowns and news.
For now, stay tuned and have a great rest of your weekend.
See You Next Sunday!